How to A/B Test Lead Magnets for Higher Conversions
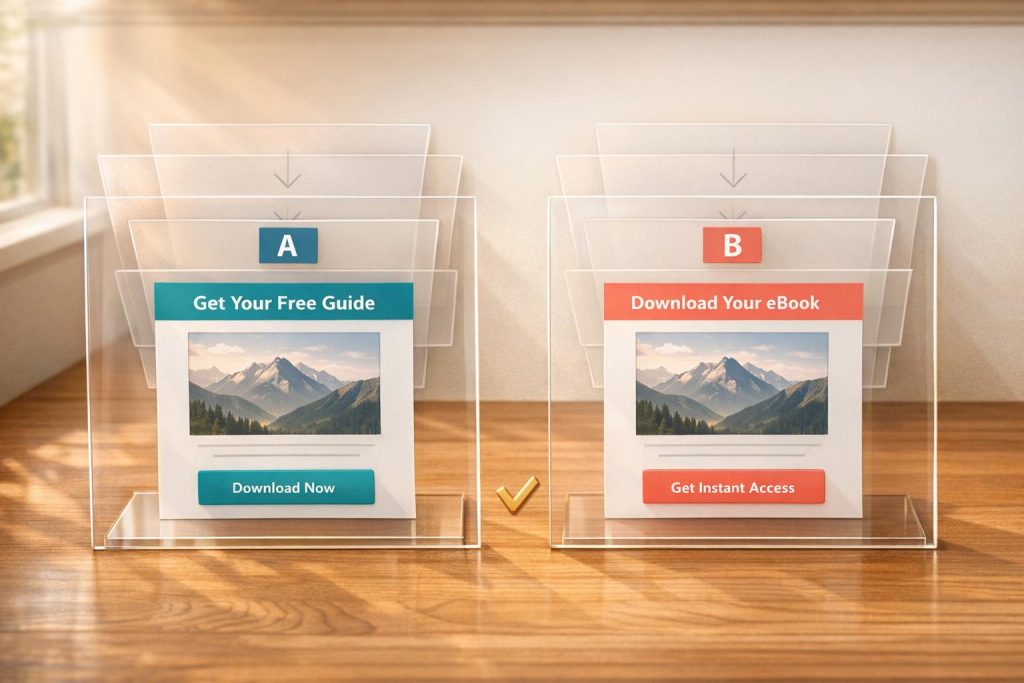
A/B testing helps you figure out what works best for your lead magnets by comparing two versions – Version A (original) and Version B (variation) – to see which drives more conversions. Whether it’s tweaking your headline, call-to-action (CTA), or design, small changes can lead to measurable improvements. Here’s the process in a nutshell:
- Set Clear Goals: Define what success looks like (e.g., increase form completions by 15%).
- Craft Testable Hypotheses: Use an "If-Then-Because" framework to predict outcomes.
- Choose Lead Magnet Elements to Test: Focus on high-impact areas like headlines, CTAs, or form design.
- Run and Monitor Tests: Split traffic evenly, calculate sample size, and track metrics like conversion rate and bounce rate.
- Analyze Results: Look for statistically significant outcomes and apply the winning version.
For example, changing a CTA from “Sign up for free” to “Trial for free” boosted conversions by 104%. A/B testing isn’t just about improving numbers – it’s about understanding your audience and making data-driven decisions. Start small, test often, and let the results guide your optimizations.
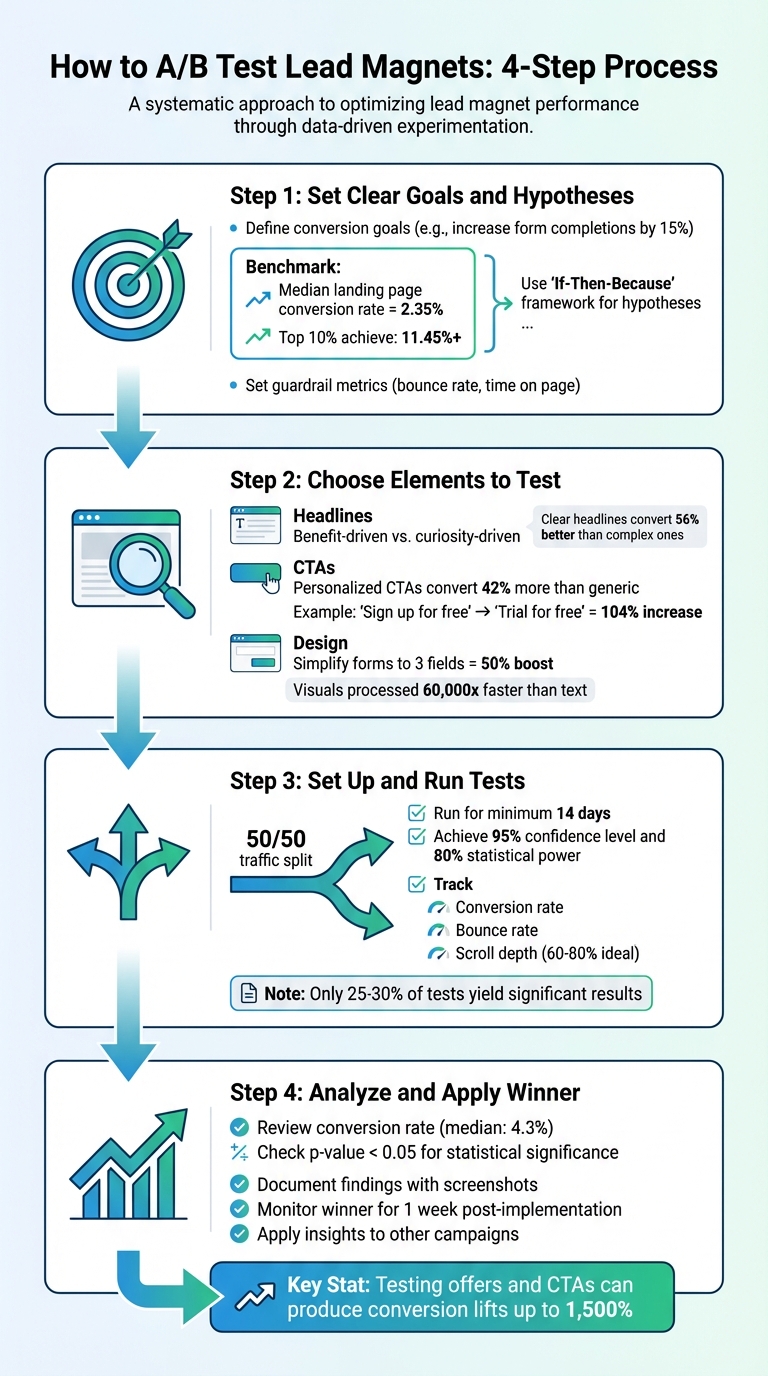
A/B Testing Lead Magnets: 4-Step Process for Higher Conversions
A/B Split Testing – How To Do It – Don Crowther
sbb-itb-b3a7196
Step 1: Set Clear Goals and Hypotheses
Before diving into A/B testing, it’s crucial to define what you’re measuring and why. Without clear objectives, testing can quickly turn into a waste of time and resources.
Define Your Conversion Goals
Start by pinpointing one primary metric that will determine the success or failure of your test. This could be anything from form completions and whitepaper downloads to trial signups or demo requests. For example, if your lead magnet landing page currently has a 1.2% conversion rate, you might aim for a 20% increase, bringing it to 1.44%.
In addition to your main goal, set guardrail metrics like bounce rate or time on page. These help ensure that any improvements in conversions don’t come at the expense of user experience.
To establish a reliable baseline, calculate your current conversion rate by dividing the number of desired actions (e.g., form submissions) by the total unique page views. For context, the median landing page conversion rate across industries is about 2.35%, while the top 10% of pages achieve rates over 11.45%. These benchmarks can guide your expectations and help you set realistic goals.
Once your conversion goals are clear, the next step is to craft a hypothesis that aligns with those targets.
Create Testable Hypotheses
A strong hypothesis is built on data and structured thinking. Use the "If-Then-Because" framework to clearly outline your predictions: If we [make this change], then [this metric will improve], because [this reason].
For instance:
"If we change the headline from ‘Download Our Free Guide’ to ‘Get 5 Proven Strategies to Double Your Leads in 30 Days,’ then form submissions will increase by at least 15%, because benefit-focused headlines address specific pain points and create urgency."
"A good hypothesis ties a user problem to a change and a measurable outcome."
- Jonathan Davies, Website Lead, involve.me
When faced with multiple test ideas, prioritize them using frameworks like ICE or PIE. These frameworks score each idea on a scale of 1–10 based on factors like impact, confidence, and ease. This helps you focus on high-impact changes – like creating effective lead magnets or improving your value proposition – rather than spending time on minor tweaks, such as adjusting button colors.
If you’re using tools like Subpage.co to create lead magnets, you can apply these strategies alongside their built-in analytics and testing features to refine your landing pages and meet your conversion goals.
With clear goals and well-structured hypotheses in place, you’ll be ready to decide which elements to test next.
Step 2: Choose Elements to Test
Now that you’ve nailed down your goals and hypotheses, it’s time to zero in on the elements that directly impact conversions. Start with the ones that pack the biggest punch. For instance, your headline is often the first (and sometimes only) thing visitors notice. Then there’s the call-to-action (CTA) – the bridge between interest and action. Elements like form fields and design can either smooth the path or create roadblocks for your visitors.
Test Headlines
Your headline is your digital handshake – it sets the tone for everything that follows. Testing different approaches can reveal what clicks with your audience. For example, does your audience lean toward benefit-driven messaging like "Save 10 Hours Per Week with Our Free Template"? (Or perhaps a checklist lead magnet for quick wins?) Or do they prefer curiosity-driven angles like "Are You Making These 5 Common Mistakes?".
Take Crown & Paw, a pet portrait brand. In August 2024, they tested three headline variations to balance emotional appeal with product value. The result? A 3.5x boost in sales.
"On the average, five times as many people read the headline as read the body copy. When you have written your headline, you have spent eighty cents out of your dollar."
- David Ogilvy
When in doubt, prioritize clarity over cleverness. Simple, benefit-focused headlines – written at a 5th–7th grade reading level – can convert up to 56% better than overly complex ones. Play around with length, power words like "essential" or "proven", and framing (e.g., positive outcomes vs. avoiding loss) to see what resonates.
Once you’ve nailed the headline, shift your attention to crafting CTAs that turn interest into action.
Test CTAs
Your call-to-action is where the magic happens – or doesn’t. Everything from the text and placement to the visual contrast of your CTA button can influence whether visitors click. Personalized CTAs, for example, convert about 42% more visitors than generic ones like "Submit" or "Click Here".
When writing your CTA, think about completing the sentence, "I want to…" A phrase like "Get My Free Guide" feels personal and action-oriented compared to a generic "Download Now". Placement matters too. While "above the fold" is often a safe bet, don’t overlook other options. For instance, forms placed at the end of long-form content – where engagement peaks – can sometimes outperform those at the top.
Make sure your CTA button stands out visually. Focus on contrast rather than specific colors to grab attention. Timing and triggers can also make a big difference. Try exit-intent popups, scroll-depth triggers, or even a slight delay to see how they impact conversions.
With CTAs optimized, it’s time to refine the design details to further smooth the conversion process.
Test Design Elements
Visual design isn’t just about aesthetics – it’s about guiding your visitors’ eyes toward the action you want them to take. Even small tweaks can lead to big results. For example, in 2021, Leadpages user Carl Taylor tested two photos of himself on his landing page. The casual photo (no suit and tie) increased conversions by over 75%. Similarly, Jae Jun of Old School Value found that a modern software mockup outperformed a traditional image by 99.76%.
Simplify your forms to reduce friction. Each additional field adds a layer of resistance. Cutting forms down to just three fields – typically name and email – can boost conversions by up to 50%. If you’re getting too many unqualified leads, you can add fields to filter for intent. On the flip side, if you need more volume, stick to just an email address.
Other impactful design tests include experimenting with color schemes, visual hierarchy, and imagery (e.g., photos of people vs. product mockups). Remember, visuals are processed 60,000 times faster than text, so high-quality imagery is key.
If you’re using Subpage.co to create lead magnets, you can apply these design tweaks directly using its Notion-like editor and pre-designed templates. Plus, you can track performance with its built-in analytics.
Lastly, keep in mind that clean, user-friendly landing pages can perform up to 4 times better than cluttered ones. Test one design element at a time to pinpoint what’s driving the results.
Step 3: Set Up and Run Your Tests
This step is where you turn your well-defined goals into actionable experiments to fine-tune your lead magnet’s performance. With your test variables selected, it’s time to create and launch variations. Focus on changing only one element at a time – whether it’s a headline, call-to-action (CTA), or image – so you can identify exactly what’s driving any changes in performance. If you’re using Subpage.co, you can easily duplicate your existing lead magnet using its Notion-like editor and make edits directly. For bigger changes, consider building a new "Challenger" variant to test an entirely different concept. The goal is to isolate the effect of each change by creating distinct versions.
Create Test Variations
Start by duplicating your current lead magnet. Then, make a single adjustment. For example, when the travel company Going changed their CTA from "Sign up for free" to "Trial for free", they saw a 104% increase in premium trial starts. Keep every other element consistent so you can measure the impact of that one change.
Focus on testing elements with the biggest potential impact, like your offer or CTA. A great offer can outperform even the most visually perfect page. As the saying goes, “A poorly designed page with an irresistible offer will always beat a beautiful page with the wrong one”. Once your variations are ready, you can split your traffic to begin testing.
Split Traffic and Calculate Sample Size
A 50/50 traffic split is considered standard because it helps you reach statistically significant results faster. While you could use a 70/30 split to maintain an established baseline, equal traffic distribution is generally more reliable. Be prepared for minor fluctuations in traffic allocation during the test.
Before launching, calculate how many visitors you’ll need for your test. Use a free online calculator like Evan Miller’s or Optimizely’s. You’ll need to input four variables: your baseline conversion rate, your minimum detectable effect (usually 10–20%), a 95% confidence level, and 80% statistical power. For instance, if your baseline conversion rate is 4.2% and you want to detect a 15% improvement, you’d need over 15,000 visitors per variant. To estimate how long the test will take, use this formula: (Sample Size × Variations) ÷ Daily Traffic = Test Duration.
"Running A/B tests without the right sample size is like flipping a coin twice and declaring the result meaningful."
- Dr. Sarah Mitchell, Statistical Analysis Lead, Where My Money Went
Run your test for at least 14 days to account for differences in weekday and weekend traffic patterns. Resist the urge to check results daily – doing so can lead to false positives. In fact, stopping a test early can inflate your false positive rate from 5% to as high as 30%.
Track Test Performance
Once your test is live, monitor its progress carefully. Track conversion rates using your platform’s analytics, and pay attention to secondary metrics like bounce rate, scroll depth, and time on page. Subpage.co’s analytics dashboard can automatically track these metrics, but you can also use tools like Hotjar or Contentsquare for deeper insights. Heatmaps and session replays can help you understand the "why" behind the numbers.
For example, in 2024, NatWest, a UK retail bank, used Contentsquare to analyze high exit rates on their mobile savings hub. By testing a more concise Fixed Rate ISA card design, they achieved a notable increase in completed applications. Additionally, segment your data by device type or traffic source. This ensures that a "winning" variant isn’t hiding poor performance on mobile devices or specific traffic channels.
Once your test reaches the calculated sample size and runs for at least two weeks, analyze the results to identify a winner. Keep in mind that only 25–30% of A/B tests yield statistically significant results, so don’t be discouraged if your first test doesn’t succeed. It often takes 3 to 5 tests to uncover a clear winner.
Step 4: Analyze Results and Apply the Winner
After running your test for two weeks and reaching the required sample size, it’s time to dive into the results. Start by focusing on your conversion rate – the percentage of visitors who completed your lead magnet form. This is the core metric for measuring success. For reference, the median conversion rate across industries is 4.3%.
Review Key Metrics
While conversion rate is the star of the show, other metrics provide valuable insights. Take a closer look at:
- Click-through rate (CTR): Are visitors clicking your call-to-action (CTA) button?
- Form start rate: Are users beginning the sign-up process?
- Form abandonment rate: A high rate here suggests friction – your form might be too long or ask for too much information upfront.
Additionally, examine bounce rate and scroll depth. Ideal scroll depth typically falls between 60% and 80% of the page. If visitors scroll far but exit quickly, they might be skimming without engaging with your content.
Don’t forget to check for statistical significance. A p-value below 0.05 (representing 95% confidence) confirms your results aren’t due to random chance. Keep in mind that only 20% of A/B tests achieve this threshold, so it’s normal if your first test doesn’t yield a clear winner. Also, segment your data – what works on desktop might not perform as well on mobile.
"Analyzing your A/B test results is important… to see how effective your hypothesis was, to figure out which variant was most successful, to understand why the test generated its results, and to make informed decisions"
- Josh Gallant, Founder of Backstage SEO
Document Your Findings
Don’t skip documentation. Record everything – your hypothesis, the variants tested, sample size, duration, and results. Include screenshots of both versions for reference. This step is invaluable for future tests, helping you avoid repeating mistakes and building on successful ideas.
Dig into the "why" behind the results. Did a new headline address your audience’s pain points more effectively? Did a simplified CTA reduce decision-making hesitation? Understanding these details ensures your insights can be applied to other marketing efforts, strengthening your overall strategy.
Apply the Winning Version
Once you’ve identified the winning variant, it’s time to roll it out. Before making it permanent, conduct a quality assurance check to confirm that all tracking codes, links, and form fields function as expected. After implementation, monitor performance for at least a week to ensure the improvement is consistent and not just a temporary spike.
Take it a step further by applying insights from your winning variant to other marketing efforts. If a specific headline or CTA style worked well, test similar strategies in your email campaigns, landing pages, or other interactive or PDF lead magnets. Use your winner as the new baseline for future tests.
"Optimization is a mindset. Never stop testing"
- Unbounce
Conclusion
A/B testing puts the power in your audience’s hands, letting their behavior guide what truly drives conversions. The process is simple yet effective: establish clear goals, test one variable at a time, allow tests to run for at least two weeks, and rely on the data to inform your decisions.
This approach is the cornerstone of a process built on data and optimization.
Key Takeaways
If you’re looking for big wins, start by testing your offers and CTAs – these areas often yield the most dramatic results. For instance, testing these elements has been shown to produce conversion lifts as high as 1,500%. A compelling example comes from WorkZone, a software company that saw a 34% increase in form submissions simply by changing customer testimonial logos from color to black-and-white next to their demo request form. This test ran over 22 days and achieved 99% statistical significance. Even smaller improvements, like a 10% increase in ad click-through rates paired with a 15% landing page boost, can significantly expand your pipeline.
To ensure accuracy, aim for 95% confidence levels and run tests across full weekly cycles to account for traffic fluctuations. Keep thorough documentation of every test result – this prevents repeating past mistakes and helps build on what works.
With these strategies, you’re well-equipped to take the next steps.
Next Steps
Identify your weakest-performing lead magnet and use Subpage to craft a testable hypothesis. This platform simplifies creating and managing lead magnet variations without needing technical expertise. Plus, it lets you track performance and gather leads all in one place.
"Optimization is a mindset. Never stop testing."
- Unbounce
Start by focusing on high-impact areas, then branch out to test other elements. Even when a test doesn’t succeed, it still provides valuable insights into what doesn’t work. The key to growth is continuous testing and refinement.
FAQs
What should I A/B test first on a lead magnet page?
The headline is the most important element to test on a lead magnet page. Why? Because it’s the first thing visitors see, and it plays a huge role in whether they stick around or bounce. A great headline grabs attention and convinces people to engage with your offer.
By experimenting with different headlines, you can figure out which one connects best with your audience and drives more conversions. Once you’ve nailed the headline, move on to testing other key elements like CTAs, visuals, or even the page layout to keep improving your results.
How do I know my A/B test has enough traffic to be valid?
To run a valid A/B test, you need enough data to reach statistical significance. The sample size required depends on factors like your website’s traffic, current conversion rate, the improvement you’re aiming for, and the confidence level you choose (usually 95%). A sample size calculator can simplify this process. If you don’t gather enough data, your results might be unreliable, so it’s crucial to wait until your traffic hits these benchmarks before drawing any conclusions.
What should I do if my A/B test has no clear winner?
If your A/B test doesn’t show a clear winner, don’t worry – it’s still a chance to learn. Start by digging into the results to spot potential issues. Was the sample size too small? Did the test fail to reach statistical significance? These are common culprits.
Next, think about external factors. Were there any unexpected events or changes that might have skewed the data? Double-check that the test was set up correctly, too – errors in configuration can easily throw off results.
If everything checks out, you might need to run the test for a longer period or increase the sample size to gather more data. Remember, even when a test doesn’t produce a decisive outcome, it can still offer valuable insights to refine your approach for future experiments.