

10 Video Metrics for Lead Generation

Views show reach – not leads. To measure lead generation, link each tutorial to a effective lead magnets, track the path from viewing to signing up, and check what each qualified lead costs.
These 10 metrics show where that path works – and where people leave:
- Reach: Views and distinct viewers show how much the video is played and how many people watch.
- Attention: Average view duration, average percentage viewed, audience retention, and completion rate show how long viewers stay and whether they reach the CTA.
- Action and conversion: CTA click-through rate, landing-page conversion rate, and video conversion rate connect viewing to clicks and sign-ups.
- Cost: Cost per qualified lead shows whether spending brings in leads that meet the business’s criteria.
Review them weekly using the same counting rules and attribution window. Test one change at a time, and check whether leads become customers – not just whether form submissions increase.
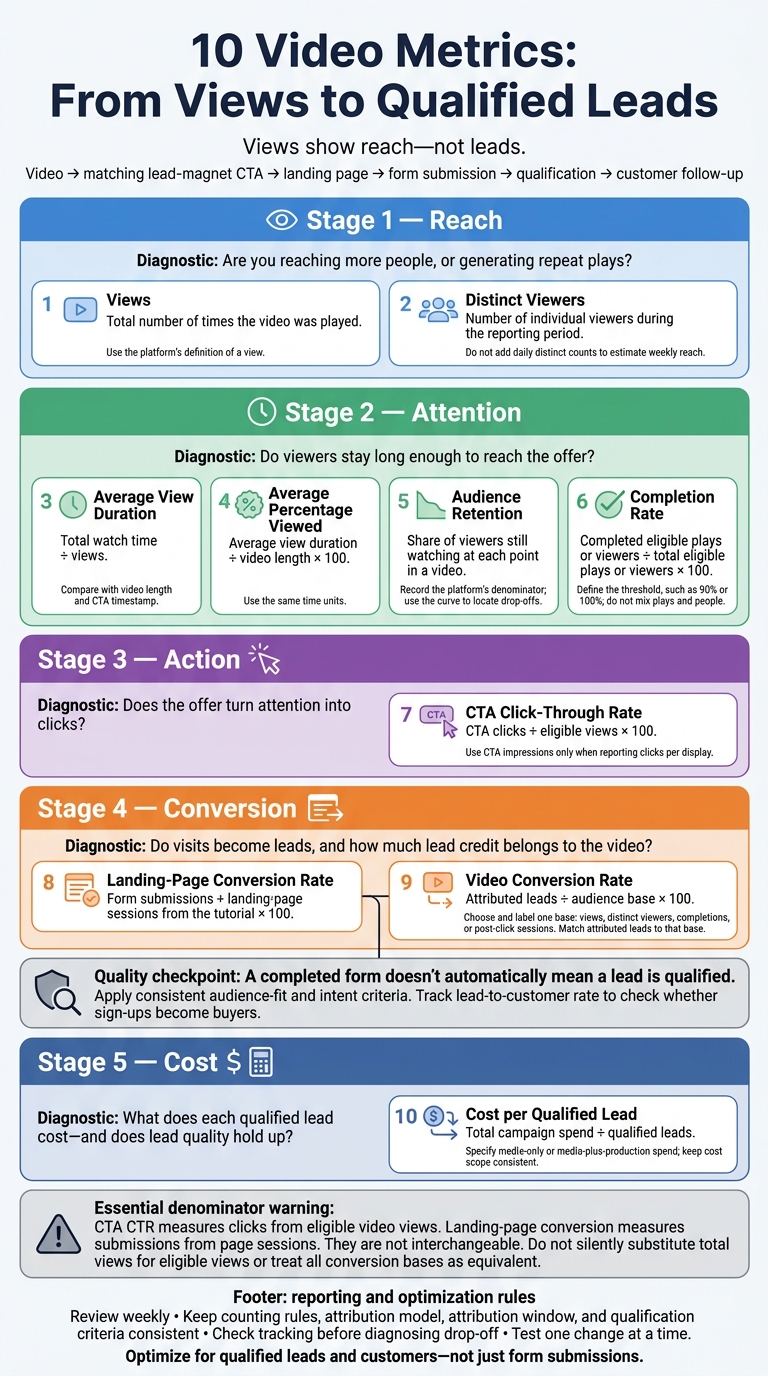
10 Video Metrics: From Views to Qualified Leads
The Key Video Metrics You Need To Know About (And How To Use Them) | Danny From The Blog
sbb-itb-b3a7196
10 Video Metrics at a Glance
Use this table to see where viewers drop out of your funnel.
| Metric | Formula or definition | Funnel stage | Lead-generation question |
|---|---|---|---|
| 1. Views | Total number of times the video was played | Reach | How many views does the video get? |
| 2. Distinct Viewers | Number of individual viewers | Reach | How many different people watch? |
| 3. Average View Duration | Total watch time ÷ views | Attention | How long do viewers stay engaged? |
| 4. Average Percentage Viewed | Average share watched per view | Attention | Does the video hold attention throughout? |
| 5. Audience Retention | Where viewers stop watching | Attention | Where do viewers lose interest? |
| 6. Completion Rate | Percentage of viewers who watch to the end | Attention | Do viewers finish the video? |
| 7. CTA Click-Through Rate | CTA clicks ÷ total views | Action | Does the CTA drive clicks? |
| 8. Landing-Page Conversion Rate | Percentage of landing-page visitors who submit the form | Conversion | Does the landing page turn visitors into leads? |
| 9. Video Conversion Rate | Sign-ups ÷ total video views | Conversion | How many views turn into sign-ups? |
| 10. Cost per Qualified Lead | Total ad and production spend ÷ qualified leads | Cost | What does each qualified lead cost? |
CTA click-through rate uses video views. Landing-page conversion rate uses page visits. They measure different steps, so don’t treat them as interchangeable.
Next, set your lead goals and tracking rules before comparing results.
Set Lead Goals and Tracking Rules
Define your audience, the problem you’ll help them solve, and the action you want viewers to take. Match your call to action (CTA) to one relevant lead magnet. Then decide whether to require a form submission for full access or offer a partial preview. Aim for qualified leads, not just submissions. Using content-focused lead magnets can help filter for higher intent.
A completed form doesn’t automatically mean a lead is qualified. Apply the same audience-fit and intent criteria to every submission, and track your lead-to-customer rate over time to see whether those sign-ups become buyers.
Use a fixed weekly reporting window, define metrics consistently, and set a baseline before testing changes.
Before rolling out changes, test the entire path from CTA click to form submission. Confirm that tracking works and source data reaches your CRM to support follow-up and attribution. Use these rules when reading the metrics that follow.
1. Views
Use the tracking rules above to treat views as a reach metric, not a lead metric.
How to Measure It
Follow your platform’s definition of a view. Record the platform, reporting period, and audience scope so you can compare results on the same basis.
Segments to Compare
Break views down by traffic source, paid versus organic distribution, and target-audience segment to see where reach comes from. Then compare each segment’s views with its CTA clicks and qualified leads.
What Results Mean
High views with few CTA clicks suggest weak follow-through. Low views with strong lead generation point to a smaller, better-targeted audience.
Next, compare views with distinct viewers to see whether your lead funnel draws from a broad audience or a concentrated group.
2. Distinct Viewers
Definition and Denominator
Distinct viewers count people who watched during the reporting period, not total plays. This helps separate audience reach from repeat viewing. Don’t add daily distinct counts to estimate weekly reach – the same person may watch on multiple days.
Lead-Generation Role
Calculate viewer-to-lead conversion only when platform data lets you match the same viewer group and conversion window. Without that match, signups divided by distinct viewers should not be presented as an individual-level conversion rate.
Segments to Compare
Review distinct viewers, repeat plays, and qualified leads together each week. This separates reach among new viewers from repeat viewing.
What Results Mean
If plays rise but distinct viewers stay flat, people are likely watching again – not expanding your audience. If distinct reach grows without more qualified leads, the tutorial may be reaching the wrong audience, or the lead magnet may not appeal to viewers.
Use this reach baseline before measuring how long viewers stay engaged.
3. Average View Duration
Definition and Denominator
Average view duration = total watch time ÷ views. Report it alongside the tutorial’s length to show how much viewers watch.
Lead-Generation Role
Average view duration helps you assess whether viewers watch long enough to reach your lead-magnet CTA. The goal isn’t just more watch time – it’s reaching the offer. This metric measures attention, but it doesn’t show where viewers leave. Compare it with the CTA timestamp and audience-retention data to check whether viewers reach the offer.
How to Read It
Compare traffic sources over the same reporting period. Review those segments weekly, along with retention near the CTA. A longer average view duration doesn’t guarantee viewers see the offer. Check audience retention for a drop before the CTA – it shows where viewers leave.
4. Average Percentage Viewed
Definition and Denominator
Average percentage viewed = average view duration ÷ video length × 100. Use the same units for both values and the same reporting window.
Lead-Generation Role
This metric puts tutorials of different lengths on the same scale. Use it to assess whether viewers stay long enough to reach the CTA.
Segments to Compare
Compare audience segments and tutorial lengths within the same reporting window.
What Results Mean
A lower percentage may point to an opening that offers too little value, poor pacing, or a mismatch between video length and viewer needs. Test one change at a time before revising the video.
Next, use audience retention to pinpoint where viewers leave.
5. Audience Retention
Definition and Denominator
Average percentage viewed tells you how much of a video viewers watch. Audience retention shows where they stop watching.
Audience retention is the share of viewers still watching at each point in a video. Record the platform’s denominator in your report – tools define it differently.
Lead-Generation Role
Use the retention curve to spot drop-off points, then place the CTA just before the biggest drop.
Segments to Compare
Compare retention on mobile and desktop alongside CTA clicks, opt-ins, and qualified leads. Device differences can affect whether viewers see the CTA and complete the opt-in.
What Results Mean
Watch for early exits, dips during complex steps, and drop-offs at the CTA. Spikes often mean viewers are rewatching a section. Sudden drops usually point to confusion or content that doesn’t meet their needs. Fix the step causing the drop before moving the CTA.
6. Completion Rate
Definition and Denominator
Completion rate = completed plays or viewers ÷ total eligible plays or viewers × 100. Define the completion threshold once, such as 90% or 100%. Use plays for session-based reporting or distinct viewers for person-based reporting. Don’t mix the two.
Lead-Generation Role
Retention shows where viewers leave. Completion shows how many reach the end – the last attention checkpoint before CTA action. Track it alongside CTA clicks and qualified leads.
Segments to Compare
Compare tutorials of similar length so the threshold represents similar viewing demands. Check device-level differences, too, such as mobile versus desktop. Keep the completion threshold and denominator consistent so the results reflect viewer behavior, not different reporting rules.
What Results Mean
High completion with few CTA clicks points to a need to test the offer or CTA. Low completion calls for checking drop-off points and fixing relevance issues.
Next, check whether those completions lead to CTA clicks.
7. CTA Click-Through Rate
Completion rate shows who reaches the end. CTA CTR shows who takes the next step.
Definition and Denominator
CTA CTR = CTA clicks ÷ eligible views × 100. Eligible views include only views that reached the CTA. Use CTA impressions as the denominator only when reporting clicks per display.
Unlike thumbnail CTR, CTA CTR measures clicks on an in-video CTA that directs viewers to a lead magnet or landing page.
Lead-Generation Role
CTA CTR tracks the move from watching to clicking – a step toward becoming a lead.
Segments to Compare
Compare placements such as mid-roll and post-roll, using only viewers who reached each CTA to calculate that placement’s CTR. Test one placement at a time to isolate the results.
What Results Mean
If CTA CTR is low, check the CTA’s placement, timing, and ease of use on mobile. If CTR is strong but leads are low, the landing page is the bottleneck. Check its conversion rate next.
8. Landing-Page Conversion Rate
Measure how often visitors arriving from a tutorial submit a form.
Definition and Denominator
Landing-page conversion rate = form submissions ÷ landing-page sessions from the tutorial × 100.
Lead-Generation Role
This metric tells you whether video traffic turns into leads.
Segments to Compare
Compare rates by tutorial, lead-magnet offer, device, and traffic source.
What Results Mean
A conversion gap that appears only on mobile points to responsive design issues. Let drop-off data guide your first test: sharpen the offer if visitors leave before starting the form, or make the form easier to complete if they start but don’t finish.
For more control over gating, Subpage.co supports partial or inline gating, so visitors can see value before reaching the form. Judge the test by qualified leads, not just submissions, and include this rate alongside qualified leads in your lead-generation report.
9. Video Conversion Rate
Definition and Denominator
After tracking CTA clicks and landing-page conversion, measure how many leads the tutorial generates.
Video conversion rate = attributed leads ÷ audience base × 100. Keep the base consistent: views, distinct viewers, completions, or post-click sessions. Count only leads tied to that same base.
Choose one attribution model – direct-click, first-touch, last-touch, multi-touch, or view-through – and use it consistently.
Lead-Generation Role
While landing-page conversion measures what happens on the page, this metric shows how much lead credit goes to the video itself.
Segments to Compare
Compare tutorials, audience segments, and CTA placements only within the same attribution model. Don’t directly compare completion-based rates with view-based rates.
What Results Mean
A higher conversion rate doesn’t always mean more leads. A video with fewer viewers may convert at a higher rate but still generate fewer leads overall. Track the lead-to-customer rate to check lead quality.
Next, compare this conversion rate with spend to calculate cost per qualified lead.
10. Cost per Qualified Lead
Once you know how many leads the tutorial generates, measure how much each qualified lead costs.
Definition and Denominator
Cost per qualified lead = total campaign spend ÷ qualified leads. Specify whether spend covers media alone or media plus production.
Set clear qualification rules, such as a work email and more than 50% of the video watched. Also define an attribution window, such as a 7-day click-through window. Count only qualified leads attributed to the tutorial within that window.
Lead-Generation Role
This metric shows what it costs to acquire qualified prospects. It checks lead-generation efficiency, not lead volume.
Segments to Compare
Compare role-based offers with general sitewide offers. Keep qualification rules, the attribution window, and cost scope the same so you’re comparing like with like.
What Results Mean
Read cost per qualified lead alongside lead-to-customer rate. A lower cost matters only if lead quality holds up.
Link Tutorial CTAs to Lead Magnets
The offer after the click should match what the tutorial teaches. Make the CTA a useful next step.
Match the asset to the lesson: use a checklist for a step-by-step tutorial, a whitepaper for a concept-heavy lesson, or a business case for a purchase decision.
Use partial or inline gating so viewers get something useful before they reach the form.
Subpage.co lets you host the lead magnet and gated page in one place. Give each tutorial its own gated page to make attribution clearer.
Connect each submission to its source video. Add UTM parameters to tutorial links so you can trace each opt-in back to the video. Keep those source tags consistent in your weekly report.
Track landing-page and video metrics separately. They measure different funnel stages. Page analytics track visits and opt-ins, while video analytics track watch time, retention, and completion.
Build a Video Lead-Generation Report
Turn the metrics above into a weekly report that shows how views become qualified leads.
Label each report with the platform, reporting period, attribution model, attribution window, and currency – for example: Nov. 1–15, 2026; LinkedIn; last-click attribution; a 7-day or 14-day window; USD.
Record the tracking tags used, and mark recent results as provisional until the attribution window closes.
Keep views, distinct viewers, watch time, retention, completion, CTA clicks, sessions, leads, and qualified leads in separate fields. Viewers may return, switch devices, or submit more than once, so these numbers aren’t interchangeable.
Show each metric’s denominator and note how each platform defines a view. Also record whether the number of times the CTA appeared was measured or estimated.
Before counting missing sessions as lost visitors, document tracking gaps caused by slow pages, late-loading tracking scripts, cross-device activity, and privacy settings – including rejected non-essential cookies. Use one contact ID to remove repeat submissions.
Use the report to find friction, not assign blame. Treat the patterns below as hypotheses: check tracking, set a baseline, and test one change at a time.
| Observed funnel pattern | Possible cause | Next test |
|---|---|---|
| Early exits in the first 10–20% | The hook may not match the thumbnail, title, or opening promise. | Test a shorter intro or move the core value proposition into the first few seconds. |
| CTA shown without clicks | The CTA may appear too late, feel too subtle, or ask too much. | Move the CTA earlier or test stronger button copy. |
| Sessions without submissions | Form friction or a message mismatch may discourage visitors. | Reduce the form to 2–3 fields or align the page headline with the video. |
| Low-cost submissions with weak qualification | The offer or targeting may be too broad for the intended audience. | Add a qualifying question, such as job role, and compare cost per qualified lead. |
Review the report weekly using the same qualification rules and attribution settings. Check cost per submission alongside lead quality: a lower cost means nothing if fewer leads qualify.
Conclusion: Focus on Qualified Leads, Not Just Views
Views measure reach. Watch metrics measure attention. CTA clicks and conversions show action, while qualified leads and the lead-to-customer rate show lead quality. Cost per qualified lead measures efficiency.
Use the report to find the biggest drop-off, then test one fix. If full gating causes people to leave, try partial or inline gating.
Evaluate the test using consistent definitions and qualification rules. Track qualified leads and customers at a cost you can maintain, not just form submissions.
FAQs
What is a good video-to-lead conversion rate?
There’s no single video-to-lead conversion rate to aim for. Results depend on your traffic source, how familiar your audience is with you, and the type of offer.
For general lead-generation pages, use these benchmarks:
- Below 3%: Below average
- 3%–7%: Solid
- 7%–12%: Strong
- 12% or higher: Elite
Cold traffic typically converts at 3%–10%, while highly specific, optimized content can reach 10%–20%. Set targets for the funnel step you’re measuring, and use tools like Subpage.co to track the same metrics consistently and make like-for-like comparisons.
How much data do I need before testing changes?
Use an online calculator to find the sample size needed for statistical significance. Enter your baseline conversion rate, minimum detectable effect, and a 95% confidence level.
As a general rule, run tests for at least 14 days to account for daily traffic changes. For top bars, aim for at least 1,000 sessions and 100 conversions. Avoid checking results daily or ending a test before it reaches the required sample size.
How do I set a target cost per qualified lead?
Start with your average customer lifetime value and target customer acquisition cost. Then multiply your acquisition cost target by your qualified-lead-to-customer conversion rate. This estimates how much you can spend per qualified lead while staying profitable.
For example, a $225 acquisition cost target and a 10% conversion rate give you a target cost of $22.50 per qualified lead.
Related Blog Posts
