How To Analyze Gated Content Performance
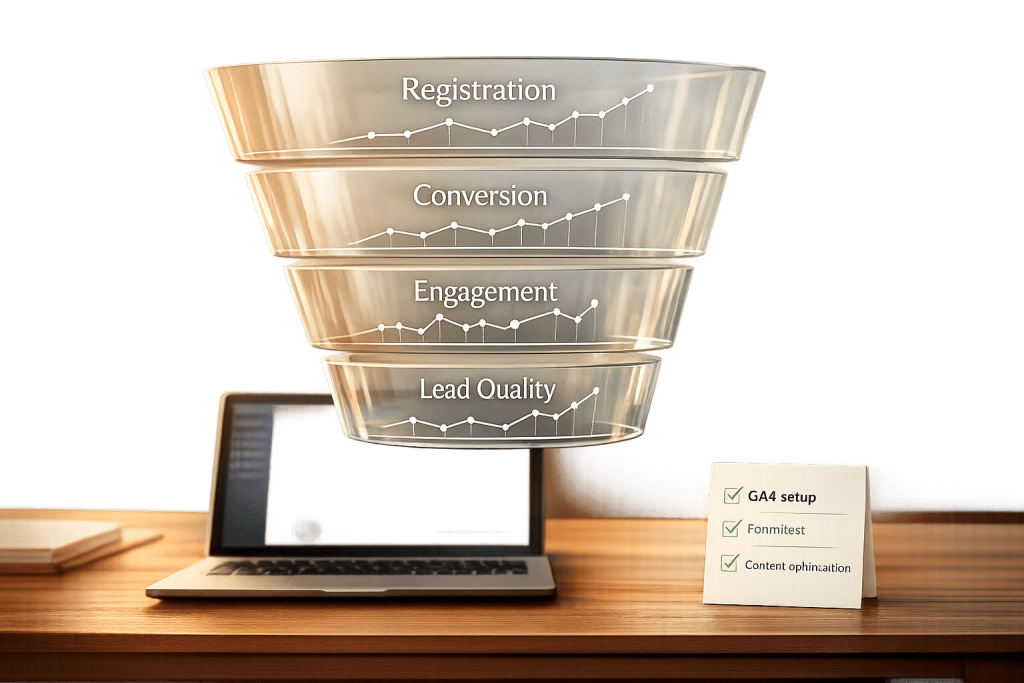
Gated content, like eBooks or webinars, is a lead generation tool where users exchange their contact details for access. To determine its success, focus on these key metrics:
- Registration Rate: Measures how many visitors fill out the form. Optimized pages can see rates of 40–80%.
- Conversion Rate: Tracks how many registrants take the next step, like booking a demo or making a purchase. Leads from gated content often outperform outbound leads.
- Post-Gate Engagement: Metrics like bounce rate and time on page reveal if the content meets user expectations.
- Lead Quality: Assess if leads align with your Ideal Customer Profile (ICP) to ensure they convert into paying customers.
Use tools like Google Analytics 4 (GA4) to track these metrics, optimize forms, and improve user experience. Platforms like Subpage.co simplify creating, managing, and analyzing gated content for better results.
Start by tracking these metrics, refining your content based on data, and testing changes to improve performance.
Key Metrics for Gated Content Performance: Benchmarks and Conversion Statistics
Key Metrics for Measuring Gated Content Performance
Tracking the right metrics can make or break your gated content strategy. These metrics help you determine if your content is attracting the right audience, providing meaningful value, and converting visitors into qualified leads.
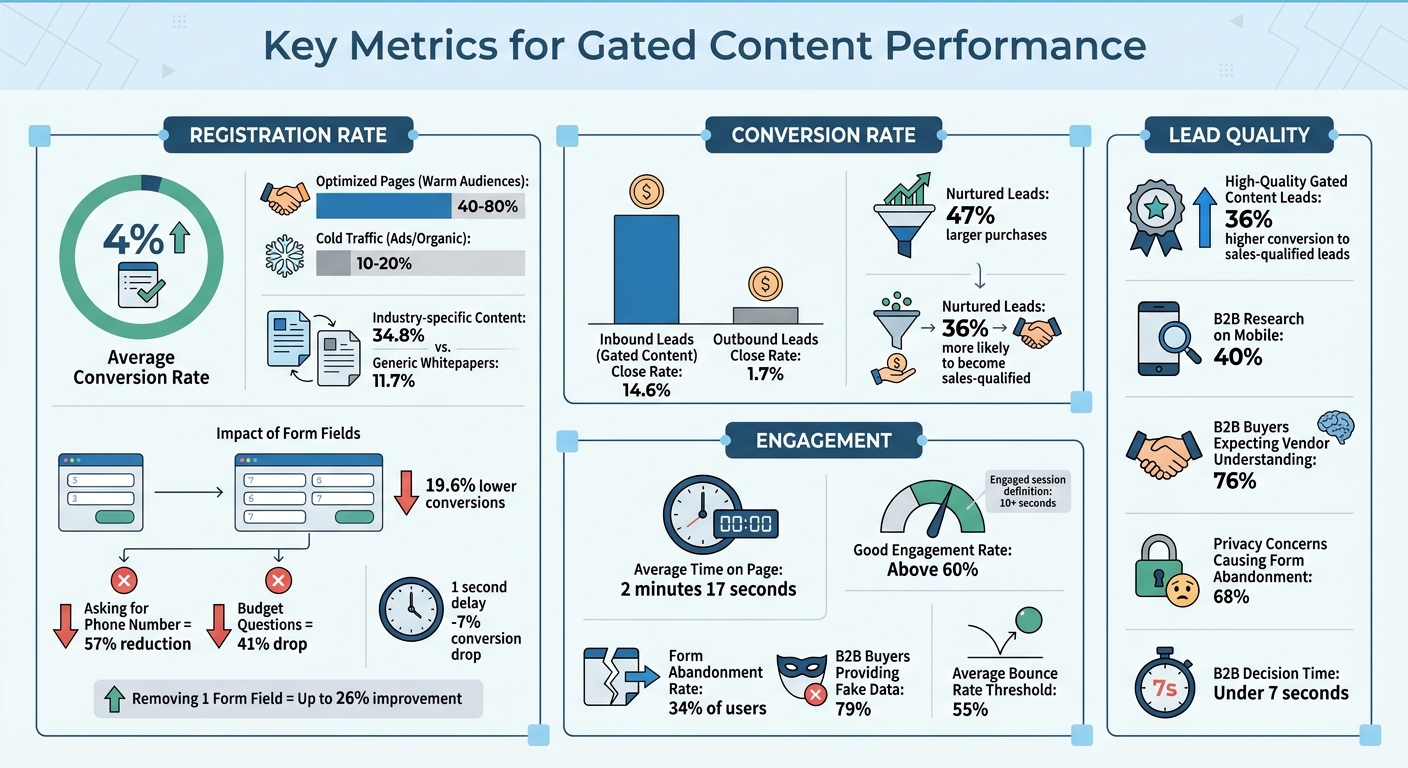
Registration Rate
The registration rate shows how many landing page visitors fill out your form to access the gated content. It’s calculated as:
(Total Form Submissions ÷ Total Visitors) × 100.
This metric highlights whether your headline, topic, and overall offer are compelling enough for users to share their personal details. On average, gated content conversion rates hover around 4%. However, optimized pages targeting warm audiences can see rates as high as 40–80%, while cold traffic from ads or organic search tends to convert at 10–20%.
For B2B prospects, the decision to engage happens in under 7 seconds, where they weigh the effort required against the perceived benefit.
Key factors that impact registration rates include form design and page performance:
- Requiring more fields (e.g., increasing from 3 to 7) can lower conversions by 19.6%.
- Asking for a phone number can reduce conversions by 57%, while budget-related questions might cause a 41% drop.
- Even a 1-second delay in page load time can shrink conversions by 7%.
"The era of uncritical content gating is over. The modern B2B buyer expects transparency and immediate added value before divulging personal data." – Ann Handley, Chief Content Officer, MarketingProfs
Industry-specific content performs better, with a 34.8% conversion rate compared to 11.7% for generic whitepapers. To maximize results, keep forms simple – limit fields to essentials like name and email. You might also try a "preview-before-gate" approach, allowing users to see a few pages of your report to build trust and encourage form completion.
After analyzing registration rates, it’s essential to track how many registrants take the next step.
Conversion Rate
While registration rates measure initial interest, the conversion rate focuses on how many registrants take the desired next action – whether it’s booking a demo, requesting a quote, or making a purchase. This metric reveals if your gated content resonates with your audience and aligns with their needs.
Inbound leads from gated content tend to perform better than outbound leads, with a 14.6% close rate compared to just 1.7% for outbound efforts. Additionally, nurtured leads often result in 47% larger purchases and are 36% more likely to become sales-qualified.
To refine your approach:
- Use lead scoring to prioritize prospects based on their engagement with your content.
- Analyze drop-off rates between content downloads and subsequent actions to identify friction points.
Beyond conversions, understanding how users interact with your content is equally important.
Post-Gate Engagement
A completed registration form is just the beginning. Post-gate engagement metrics like bounce rate, time on page, scroll depth, and session duration reveal whether your content fulfills its promise or leaves users disappointed.
For example, a high bounce rate immediately after accessing gated content could indicate a mismatch between the landing page’s promise and the actual content delivered. On average, users spend about 2 minutes and 17 seconds on a page. Longer engagement times typically signal that your content is valuable and engaging.
To dive deeper into user behavior:
- Use heatmaps to track scroll depth and identify where readers lose interest.
- Monitor whether users explore additional pages, which can indicate that your content is effectively guiding them through the buyer’s journey.
- Behavioral analytics tools can highlight issues like broken links or confusing layouts that might frustrate users.
Lead Quality and Audience Fit
Lastly, evaluate the quality of your leads by comparing registrant data – such as job title, company size, and budget authority – against your Ideal Customer Profile (ICP). A high registration rate means little if those leads don’t convert into paying customers. Tracking the lead-to-customer conversion rate will help you gauge the effectiveness of your overall strategy and ensure alignment between marketing and sales.
"The critical mistake many B2B companies make is gating awareness content. This not only drastically reduces reach but also leads to unqualified leads who only want to access the content without genuine purchase interest." – Tamsen Webster, Messaging Strategist
To improve lead quality while reducing friction, consider progressive profiling. Start by asking for only 2–3 essential fields during the first interaction, then collect more details in future engagements. This approach allows you to gradually build a richer profile of your prospects without overwhelming them upfront.
sbb-itb-b3a7196
How to Use Analytics Tools to Track Performance
Now that we’ve covered key metrics, let’s dive into how to track and analyze them using Google Analytics 4 (GA4). GA4 simplifies the process with its Enhanced Measurement feature, which automatically tracks form interactions – no coding required.
Setting Up Analytics for Gated Content
To monitor registrations for gated content, start by enabling "Form interactions" in your GA4 settings. Here’s how you do it:
- Go to GA4’s Admin panel.
- Navigate to Data Streams > Web Stream.
- Turn on the "Form interactions" toggle under Enhanced Measurement.
This setup will automatically capture two key events:
form_start: When a user clicks on your form.form_submit: When the form is successfully completed.
For high-value submissions, tag gated content events as generate_lead. Then, mark these events as "Key Events" in the GA4 Admin panel so they can be tracked as conversions.
Different forms may require different tracking methods:
- Redirect Forms: If your form redirects users to a thank-you page, set up a custom event in GA4. Name the event
page_viewand configure it to monitor the URL of the thank-you page. - AJAX or Popup Forms: These forms don’t trigger page redirects. Use GA4’s built-in "Form interactions" or set up custom triggers and tags in Google Tag Manager (GTM) .
Here’s a quick breakdown of tracking methods:
| Tracking Method | Ideal For | Setup Requirement |
|---|---|---|
| Enhanced Measurement | Standard HTML forms | Enable "Form interactions" in GA4 |
| Thank-You Page | Forms with redirects | Create custom events based on page_location |
| Google Tag Manager | AJAX/Plugin-based forms | Use custom triggers and tags |
| Success Message | Inline "Success!" messages | Track via CSS selectors |
Once your setup is complete, use GA4’s DebugView to test it. Submit a few forms and check the Realtime report to ensure events are firing correctly. If you manage multiple gated assets, create specific events that combine form_submit with unique URLs to differentiate performance.
"Form submissions usually mean leads, signups, or sales. They are the real conversions that show if your site is doing its job." – Stacey Corrin, OnePageGA
Important Reminder: Never pass personally identifiable information (PII) like names or email addresses into GA4. Doing so violates Google’s policies and could result in account suspension.
Monitoring Key Performance Indicators
Once tracking is in place, shift your focus to analyzing the data. GA4’s dashboards let you monitor key performance indicators (KPIs) in real time. Use the Traffic Acquisition report and filter by the "Key Events" column to see which marketing channels – like organic search, paid ads, or social media – are driving the most leads. This insight helps you fine-tune your budget and focus on the most effective strategies.
To dig deeper, create a GA4 exploration using "Event name" and "Landing page" to identify your best-performing gated assets. Pay close attention to the ratio between form_start and form_submit events. A high drop-off rate may indicate your form is too long. Fun fact: cutting just one field can improve conversion rates by up to 26%.
Beyond form submissions, explore engagement metrics like:
- Average Engagement Time: Excludes idle time and gives insight into how long users actively interact with your content.
- Scroll Depth: Shows how far users scroll through your content.
Content that resonates typically has an engagement rate above 60% and an average engagement time of over two minutes. GA4 defines an "engaged" session as one lasting more than 10 seconds, including a conversion event, or involving two or more pageviews.
Use funnel explorations to map the user journey step by step: Landing Page → Form Start → Form Submit → File Download. This visualization helps pinpoint where users drop off . Additionally, track assisted conversions using attribution models to see if gated content played a role earlier in the sales funnel.
Keep in mind that GA4’s lead counts might not match those from ad platforms. GA4 only tracks leads if users click through to your site, while ad platforms may count "view-through" conversions – users who see your ad but don’t click. Also, GA4 uses a 90-day lookback window for Key Event attribution.
How to Improve Gated Content Based on Data
Using data to refine your gated content can make a huge difference. The average conversion rate for gated content is just 1.9%, so there’s plenty of room to experiment and improve. The key is identifying what’s not working and testing targeted changes to address those issues.
Finding Underperforming Content
Start by comparing the number of visitors to your landing page with the number of completed forms. If your conversion rate is below 1.9%, it could mean your audience doesn’t see enough value in your offer. High bounce rates – anything above 55% [6, 16] – are another warning sign that your value proposition isn’t clear.
Pay attention to where users drop off during the form process. About 34% of users abandon forms halfway through, often when asked for sensitive information like phone numbers. If you notice a spike in fake entries (like "Mickey Mouse" or bogus email addresses), that’s another indicator of friction – 79% of B2B buyers admit they routinely provide fake data in forms.
But don’t stop at form submissions. Dig deeper with tools that track scroll depth or time spent on the page. If users download your whitepaper but only glance at the first page, it’s a sign your content might not be engaging or relevant [14, 6].
Once you’ve pinpointed these issues, you can move on to testing solutions.
A/B Testing Gated Content Formats
When you’ve identified underperforming areas, A/B testing can help you figure out what works. Focus on one variable at a time to see its direct impact.
Start with a clear hypothesis. For instance: "Reducing the number of form fields from five to three will increase registrations by 10%." This approach keeps your tests focused and measurable. Remember, every additional field in a form can reduce conversions by roughly 4%. Stick to collecting only the basics – usually just a name and email address.
Run your tests for at least one to two weeks to account for daily variations and ensure enough data for reliable results. Experiment with how you deliver content. For example, compare sending the asset via email versus providing instant access on the page. Another option is a "preview-before-gate" strategy, where users can view 2–6 pages of the content before completing the form. This can help build trust by showing value upfront. Don’t forget to test your call-to-action (CTA) text – specific, benefit-focused CTAs like "Get the Free Guide" often outperform generic ones.
Improving Content for Better Engagement
After identifying successful adjustments through A/B testing, focus on improving the content itself to encourage deeper engagement. High-quality gated content can generate marketing-qualified leads with a 36% higher conversion rate to sales-qualified leads. This means your content needs to attract the right audience, not just a high number of clicks.
"If most people fill out the form but only read the first three pages, the content itself needs work. If they’re reading 80%+ of the document, you’ve created something genuinely valuable." – FlipLink
Use analytics to track where readers lose interest. If engagement drops off at a specific section, refine that part with better visuals, clearer insights, or more actionable takeaways. Tailor your content to address the needs of your audience – 76% of B2B buyers expect vendors to understand their unique challenges.
You can also try progressive profiling instead of asking for everything at once. Start with basic information and collect more details over time as trust builds. This approach can help ease privacy concerns, which cause 68% of prospects to abandon forms.
Lastly, don’t overlook mobile optimization. With 40% of B2B research now happening on mobile devices, it’s crucial to ensure your forms and content are easy to navigate on smaller screens. Test the entire user journey on a smartphone to catch any potential issues that desktop users might not experience.
Using Subpage.co for Gated Content Analytics
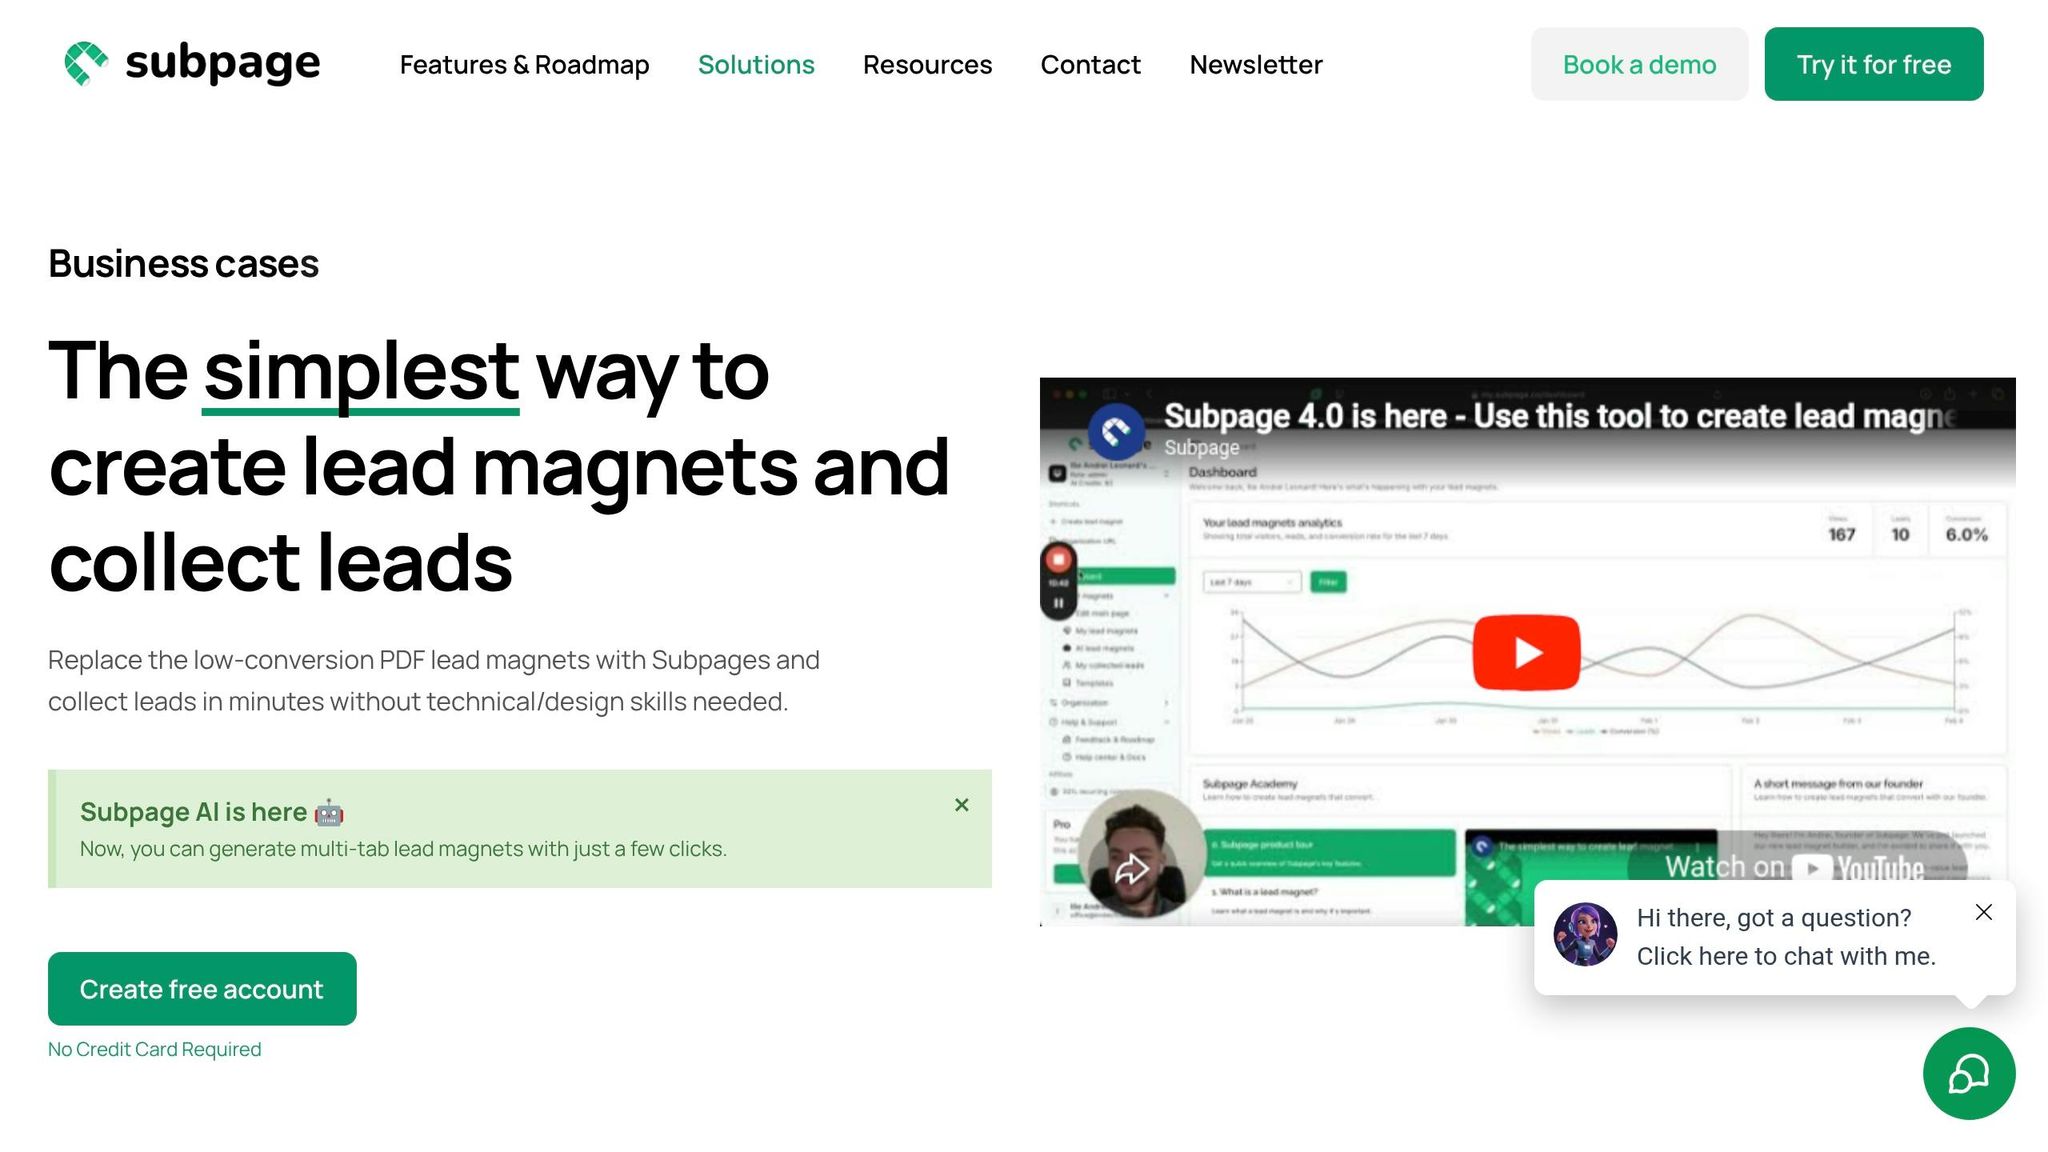
If you’re looking for a simple way to create and analyze gated content, Subpage.co has you covered. It combines lead magnet creation with performance tracking in one platform. Here’s how Subpage.co simplifies the process.
Creating Lead Magnets with Subpage.co
Subpage.co’s editor is user-friendly and doesn’t require any technical know-how. You can copy content directly from Google Docs, paste it into the platform, and then enhance it with interactive features like videos, forms, or chat buttons. One standout feature is its AI tool, which converts static PDFs into interactive lead magnets – making the process quick and efficient.
"This is the FASTEST that I have ever set up a lead capture page! Literally a few clicks and the page was live." – Sumoling_Number_1
Customization options are plentiful. On the Premium plan (starting at $19 per organization per month), you can use a custom domain, incorporate your brand colors, and remove Subpage branding. The platform also offers flexible gating options, such as forms for file downloads, pop-ups, and lead generation widgets. Plus, A/B testing lets you experiment with different approaches to see what works best.
Tracking Metrics with Built-In Analytics
Once your lead magnet is live, measuring its performance is key. Subpage.co offers built-in analytics to track registrations and engagement. It also includes email validation to ensure the leads you collect are high-quality. For deeper insights, you can integrate external tools like Google Analytics, Hotjar, or Mixpanel by adding an embed code to the page.
The Free plan gives you access to analytics and lead data for the past 7 days, while the Premium plan offers unlimited historical data. This allows you to spot trends and track conversions over extended periods.
Managing and Exporting Leads
All the leads you collect are stored on the platform and can be exported as a CSV file or synced with other tools using Zapier or webhooks. Leads are organized by "Organization", making it simple to monitor performance across multiple projects or business units. This streamlined organization helps you make data-driven adjustments to your gated content strategy.
"I’ve now fully integrated Active Pieces with Subpage, and I feel very satisfied. The JSON received is neat and intuitive." – Miggy
For large-scale lead generation, webhooks allow you to automate the transfer of leads directly to your CRM or email marketing tools in real time. Subpage.co users have reported generating over 1,000 leads in just two weeks, showcasing its ability to scale while maintaining clean and organized data exports.
Conclusion
Using data to analyze the performance of gated content is both straightforward and effective. By focusing on key metrics like conversion rates, engagement, and lead quality, you can uncover clear insights into what’s working and where adjustments are needed. For context, well-optimized gated content often achieves conversion rates between 40% and 80%, compared to the industry average of just 4%. This highlights a big opportunity for improvement when you consistently test, measure, and refine your strategy.
Techniques like A/B testing, funnel analysis, and lead scoring help turn raw data into actionable insights that can improve your results.
To make things even easier, tools like Subpage.co simplify the process. With this platform, you can create interactive lead magnets, track performance using built-in analytics, and manage leads efficiently. Features like real-time updates and detailed engagement tracking allow you to optimize your content based on how users actually interact with it.
Start small by focusing on one or two metrics that align with your business goals. Whether you’re aiming to boost conversion rates or lower form abandonment, consistent tracking and iteration will deliver results. With tools like Subpage.co at your disposal, you have everything you need to take your gated content strategy to the next level.
FAQs
What should I gate vs leave ungated?
Gated content – think eBooks, webinars, or templates – is perfect for generating leads. Why? Because users willingly share their contact details to access it. This makes it a great tool for collecting leads and pinpointing highly engaged prospects.
On the other hand, ungated content – like blogs and infographics – is openly available to everyone. It’s fantastic for building trust, increasing brand awareness, and boosting SEO.
The key is finding the right balance: use ungated content to draw in your audience, then leverage gated content to turn those visitors into leads.
How do I track downloads after a form submit in GA4?
To monitor downloads after a form submission in GA4, start by enabling the file_download event within the Enhanced Measurement settings. This feature automatically tracks user clicks on downloadable files, such as PDFs, provided the clicks occur after the form submission.
For more detailed tracking, you can create custom events to directly associate downloads with form submissions. That said, enabling Enhanced Measurement remains the easiest method for capturing basic download activity.
How can I improve lead quality without adding more form fields?
To improve lead quality without making forms longer, focus on gating only your most valuable content – think original research or in-depth reports that naturally appeal to your target audience. Keep an eye on metrics like conversion rates and engagement levels to pinpoint which resources attract the most qualified leads. By adjusting your gating strategy based on how well specific content performs, you can zero in on prospects who are genuinely interested – without complicating your forms.